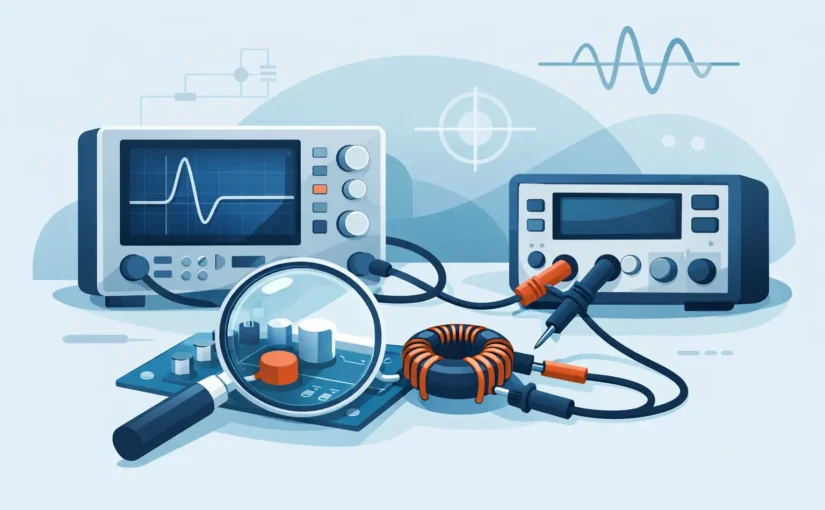
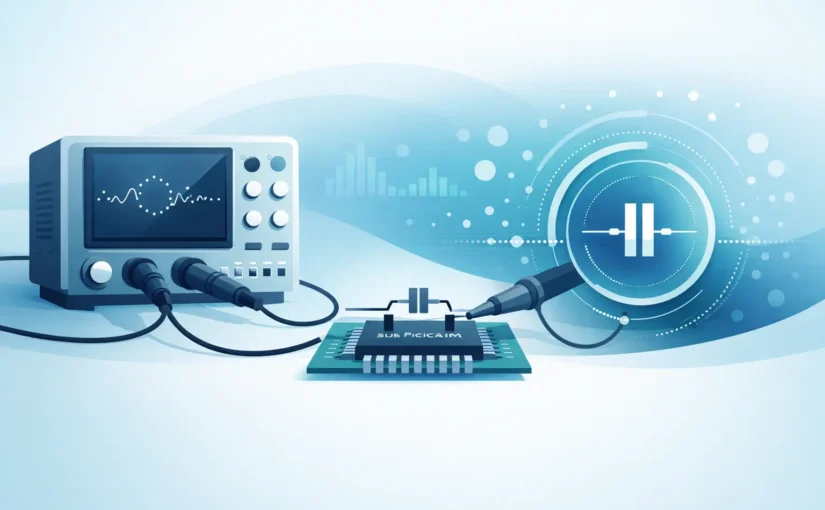
A board can pass visual inspection, show no obvious thermal damage, and still contain a failed semiconductor junction, a leaky capacitor, or a shorted IC input. Analog signature analysis for PCB repair gives technicians a fast way to locate those faults without powering the board or removing every suspect component. Instead of asking only, “What is this component’s value?”, it asks, “How does this circuit node behave electrically compared with a known-good node?”
That distinction matters on dense assemblies where components are connected in parallel, schematics are incomplete, and applying power may place an expensive board at further risk. Used correctly, analog signature analysis is a comparative diagnostic method that narrows the fault area quickly. It does not replace precision LCR, ESR, voltage, or waveform measurements. It tells the technician where those more specific measurements will produce the highest value.
What Analog Signature Analysis Measures
Analog signature analysis, often called ASA or VI signature analysis, applies a controlled AC stimulus to an unpowered test point and observes the resulting current-versus-voltage relationship. The instrument displays that relationship as a trace. A resistor, capacitor, diode, transistor junction, and integrated-circuit input each produce a characteristic response because each presents a different impedance and nonlinear behavior.
A purely resistive path typically produces a straight diagonal line. The slope changes with resistance: lower resistance produces a flatter trace, while higher resistance produces a steeper trace. Capacitive and inductive behavior introduces an elliptical pattern because current and voltage are phase shifted. Semiconductor junctions produce curved or asymmetric signatures as conduction begins in one direction.
The useful result is not a catalog of ideal shapes. Real PCBs contain component tolerances, parallel paths, protection devices, and circuit loading. The diagnostic value comes from comparison. When the same node on a good board produces one signature and the suspect board produces a distinctly different one, the difference is evidence of a fault or a meaningful circuit-state change.
Why Analog Signature Analysis for PCB Repair Works
Most board-level failures change impedance before they become easy to identify with a conventional continuity test. A shorted ceramic capacitor may look like a low-resistance path. A degraded diode may conduct too early or differently in reverse bias. An ESD-damaged IC pin may not be fully shorted, yet its signature can differ markedly from the matching pin on a good board.
ASA is particularly effective because it is performed with the assembly unpowered. That reduces the chance of energizing a shorted supply rail, triggering intermittent firmware behavior, or damaging a sensitive load while troubleshooting. It also allows a technician to examine a circuit systematically when a board has no accessible test firmware or when its normal operating sequence is unknown.
A known-good reference is the central requirement. It may be an identical working PCB, a redundant channel on the same assembly, or a repeated circuit section. Comparing left and right audio channels, identical driver stages, multiple power phases, or replicated I/O circuits can reveal an outlier rapidly. A comparison between unlike nodes is much less meaningful.
Reading Signatures Without Overinterpreting Them
The most common mistake in signature analysis is treating every curve as a definitive component identification. On an assembled PCB, the signature is the response of the entire network connected to the probe point. A diode trace may include a resistor divider. A capacitor trace may be altered by a parallel IC input. A supply rail can show the combined behavior of dozens of decoupling capacitors and semiconductor protection structures.
For that reason, the first question is not “Which component makes this shape?” It is “Does this point match the corresponding point on the reference?” A symmetric circuit should generally show symmetric signatures when measured using the same ground reference, range, stimulus level, and probe orientation.
Probe polarity also matters. Reversing the probes reverses the display relationship and can change the apparent behavior of polarized devices and junctions. Maintain a documented probe convention throughout the inspection. If a difference is observed, repeat the measurement to rule out poor probe contact, contamination, an oxidized pad, or a shifted test position.
Stimulus level and frequency influence the result as well. Low-level testing may avoid turning on certain junctions, while a higher stimulus can reveal nonlinear conduction. Frequency changes the apparent response of capacitive and inductive paths. Consistent settings are essential when comparing boards. A signature library built with mixed settings is not a reliable repair reference.
Common Fault Patterns
A rail that produces a much flatter signature than the reference often indicates excess conductance, such as a shorted capacitor, damaged regulator, or failed IC. A signature that becomes more vertical may indicate an open connection, lifted component, broken trace, or increased resistance in the path.
An asymmetric trace where the reference is symmetric can point to a diode, transistor junction, or ESD structure that has changed behavior. A distorted ellipse in a timing or filtering network may indicate a capacitor with altered effective capacitance, excessive leakage, or an added parallel path. These patterns are starting points for investigation, not final diagnoses.
A Controlled PCB Repair Workflow
Begin with the board fully de-energized. Disconnect batteries, external supplies, and stored-energy sources. Allow large capacitors to discharge safely, then verify the rail voltage before connecting the analyzer. Analog signature work on a partially powered assembly can produce misleading results and may damage the instrument or board.
Establish a stable reference ground close to the circuit under test. Then inspect broad functional areas first: input power, primary and secondary rails, major connectors, repeated channels, and suspect IC pins. This approach prevents the technician from spending time probing every component before identifying the region where the signatures diverge.
When a mismatch appears, move inward. Compare adjacent nodes, both sides of series resistors or ferrite beads, nearby decoupling capacitors, and corresponding pins on duplicated circuits. The goal is to determine whether the abnormal response follows a rail, stops at an isolation component, or is localized to one device connection.
Document the measurements with board revision, test point, reference location, instrument settings, and probe orientation. In production repair and quality environments, this turns a one-time observation into repeatable evidence. Bluetooth-enabled recording instruments can further support trace capture and comparison when documentation requirements extend beyond a technician’s bench notes.
Where Precision LCR and ESR Measurement Take Over
ASA is excellent for locating an anomaly, but it cannot always separate a failed part from the network around it. Once the suspect area is isolated, direct component measurement provides the confirmation needed for a reliable repair decision.
For example, a distorted signature around a switching regulator output may identify the output capacitor bank as the likely region. An ESR measurement can then identify a capacitor whose loss is excessive under the relevant test conditions. A precision LCR measurement can verify capacitance, inductance, resistance, dissipation factor, or quality factor where the board topology permits. If parallel paths mask the result, lifting one terminal may still be necessary.
This is where direct-contact tweezer measurement is valuable. Small SMD components can be measured at the pads with controlled contact and minimal lead length, reducing errors caused by test leads and handling. Smart Tweezers® instruments are designed for this workflow, combining automatic component identification with precision measurements for values that are difficult to evaluate using a general-purpose meter alone.
The trade-off is clear: in-circuit measurements are fast but affected by surrounding circuitry; out-of-circuit measurements are more definitive but require time and may risk pad damage during removal. The best repair process uses the least invasive test that can support a confident decision.
Limits That Protect Good Diagnostics
Analog signature analysis is not a substitute for powered functional testing. It will not verify firmware execution, clock integrity under operation, switching-node waveforms, communication timing, or load regulation. A board can match a reference while still failing only under temperature, current, vibration, or software-controlled conditions.
It is also less decisive when no valid reference exists. In that case, schematics, expected component behavior, localized LCR and diode testing, and voltage-resistance comparisons become more important. Building a signature archive from known-good production boards is therefore a practical investment for repair departments handling recurring assemblies.
The strongest technicians do not use one instrument mode as a verdict. They use analog signatures to find the electrical difference, precision measurements to identify the failed element, and controlled power-up testing to prove that the repair restored the required circuit behavior. That sequence protects the board, shortens fault isolation, and creates repair evidence that can be repeated on the next difficult assembly.